When a user encounters an issue in an application built on Microservices, a single request may pass through dozens of different services before reaching its final destination. Identifying the root cause of a problem can become extremely challenging. This is where Distributed Tracing comes into play.
Distributed Tracing is a technique that enables engineers to track the complete journey of a request as it travels across multiple services within a distributed system.
In modern architectures, a single request may pass through:
A delay or failure in any of these stages can negatively impact the entire user experience.
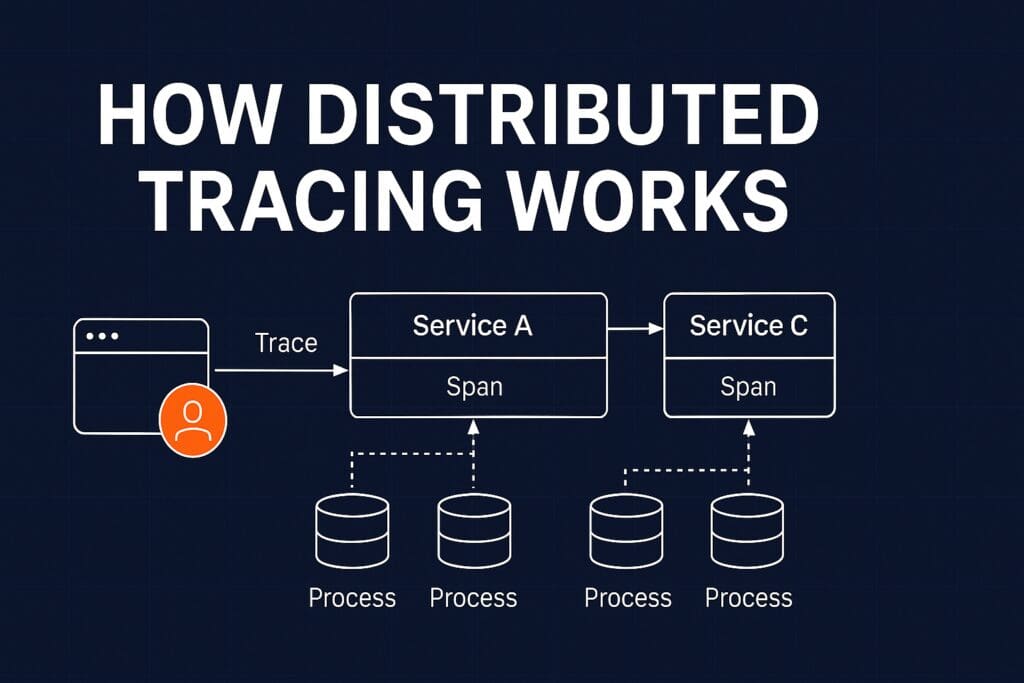
Each request is assigned:
A unique identifier representing the entire request journey across all services.
A unique identifier for each individual operation or step within that journey.
This allows engineers to visualize and analyze the complete path of a request from start to finish.
Quickly identify the exact location of failures or performance issues.
Detect slow services and latency bottlenecks.
Gain full visibility into how requests flow through the system.
Provides isolated events and application messages.
Provides a complete end-to-end view of a request’s journey across multiple services.
Not always. Small applications may not require it, but it becomes highly valuable as system complexity grows.
Yes. Modern observability platforms support integration with Grafana, especially when using tools such as Tempo and OpenTelemetry.
Distributed Tracing has become an essential observability tool for understanding and optimizing distributed systems. As organizations increasingly adopt Microservices and cloud-native architectures, tracing provides the visibility needed to diagnose issues, improve performance, and maintain reliable services.
") United Arab Emirates (Arabic)
United Arab Emirates (Arabic)") Worldwide (English)
Worldwide (English)